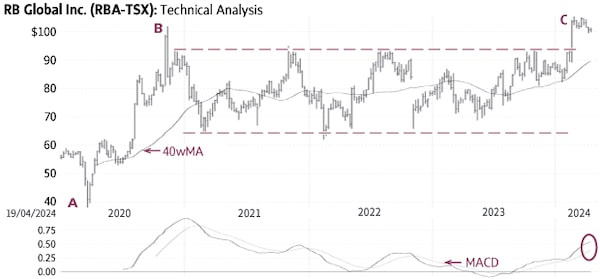
RB Global RBA-T had a considerable rise over eight months from $37.76 in March 2020 to $101.93 in November (A-B). The stock then settled in a large three-year trading range mostly between $65 and $94 (dashed lines). The recent rise above the top of this range signaled a breakout and the start of a new uptrend toward higher targets (C).
Behaviour indicators including the rising 40-week Moving Average (40wMA) confirm the bullish status. There is good support near $93-95; only a sustained decline below this level would be negative.
Point & Figure measurements provide targets of $115 and $125. The large trading range (dashed lines) supports considerably higher targets.
stock
Monica Rizk is the Senior Technical Analyst of the Phases & Cycles publication (www.capitalightresearch.com). Chart source: www.decisionplus.com
 Monica Rizk